Via SpotGamma,
The link between options flow and the underlying shares is based on the concept that options dealers and market makers buy and sell shares of underlying stock to hedge option positions. These hedging requirements are generally measured through Delta (the number of shares required to hedge an option from the directional move of the underlying) and Gamma (the rate of change of Delta).
The impact of options trading on underlying equities is now well-accepted, following both the GameStop (GME) and AMC Theaters (AMC) saga of 2021, and the recent 0DTE flow affecting major US indices such as the S&P 500.
While there are now many documented cases of option flow driving stock prices, we also see examples where options activity is incorrectly blamed as a scapegoat for equity moves.
Case in point, last week the WSJ published an article titled: “Did Options Trading Fuel a 47% Plunge in Western Alliance Stock? The CFO Thinks So“. Let’s investigate:
The Setup
Western Alliance shares lost almost half their value in a single session last month. The bank’s CFO says options traders are partly to blame.
The shares dropped 47% to $26.12 on March 13, down from around $49 the prior session. Dale Gibbons, the bank’s chief financial officer, says a burst of put options trading—alongside thin activity in the pre-market session—was in part behind the move.
In the prior session, on March 10, options activity tied to the bank skyrocketed after almost no trading for most of the year, Cboe Global Markets data show. Mr. Gibbons says the aggressive trading, especially in bearish put options, helped drive the shares lower.
A snippet of what he said about put options trading on the bank’s earnings call this week is worth a read:
“To me, that’s somebody that had an agenda and then on Monday morning, before the market opens at 5 AM New York Time, they were in the pre-market session selling and nobody trades pre-market, so it’s pretty easy to move the stock price around and push it down, down, down.”
-WSJ
Bank Weakness Ahead of Move
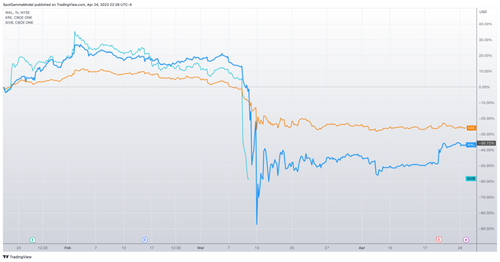
Several days before the March 13th WAL crash, Silicon Valley Bank (SIVB, teal) was closed by the FDIC. These events placed heavy pressure on all regional banks as shown by the KRE price line (orange), leading to a -25% decline in that regional bank ETF. In sympathy, WAL stock dropped 50% the week of 3/8, which was before the stock fell another 50% on Monday, March 13th.
Options Volumes Reflected Bullish Support
Looking at basic volume metrics below, we can see that the options volume started to increase the week of March 6th, with a spike in options volume on March 13th. On the 13th call volume (blue) exceeded put volume (orange), as the stock opened at $12, and closed at $26.
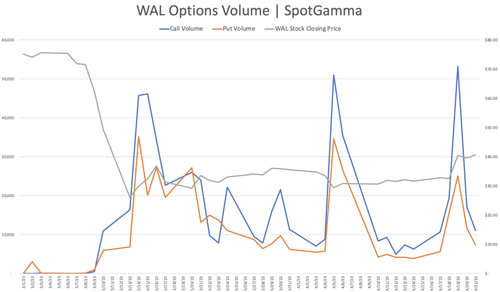
Further, the stock traded higher in the following days. Since equity options don’t start trading until 9:30AM ET, it’s unlikely that options volume could have driven the opening low on the 13th.
Open Interest Confirms Limited Hedging Requirements
Is it possible that hedging flows from existing options positions were a major driver?
For that we first turn to open interest, and you can see that both put and call open interest are quite low until after the 3/13 stock lows. Low open interest implies less options related hedging is required.
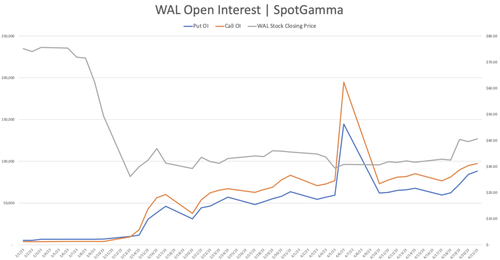
Further, the call open interest exceeds put open interest as the stock hits those major 3/13 lows. The implication with this is that traders appeared to be looking to place more net long bets on the stock.
Gamma Analysis Aligns with Volume and Open Interest Assessments
To get an understanding of the possible hedging impact of options hedging flows, we looked at the maximum amount of stock volume that could be tied to WAL options. To do this, we convert the notional value of WAL options Gamma into equivalent shares for both puts and calls. As you can see there is a spike in Gamma-related volume the week of 3/8, but then Gamma goes to nearly zero, which signals a small options hedging impact on the underlying stock.
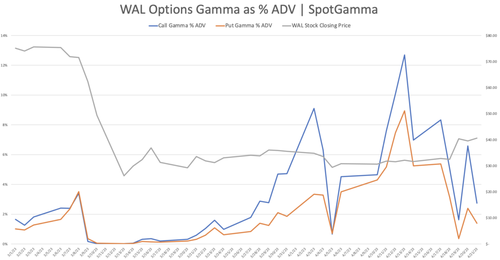
This reduction in Gamma is likely due to the fact that when the stock declined to lows <=$25, most of the WAL put options went deep in the money, and calls went out of the money. These positions require little to no additional hedging.
Stock Volumes Increased to Diminish Hedging Requirements
Adding to this, over the week of 3/8 WAL stock volume surged, as shown in gray. This suggests that the relative impact of WAL options hedging was additionally reduced, because options hedges would be a lower share of relative volume.
To depict this we’ve plotted the maximum possible shares required to hedge both puts (blue) and calls (orange). We’d note here that in all likelihood the related hedging pressure would be in actuality lower, as a portion of put and call positions likely offset each other, requiring less hedging.
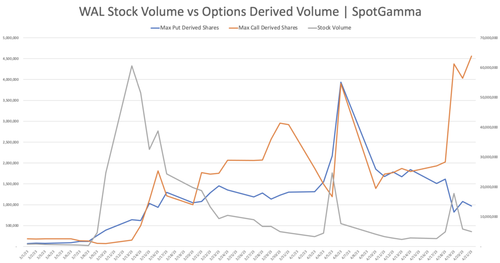
Another way to see this impact is to look at the maximum possible hedging flow tied to open options positions on March 13th. This shows that the requirement is less than 10% of the stocks total average daily volume, at best.
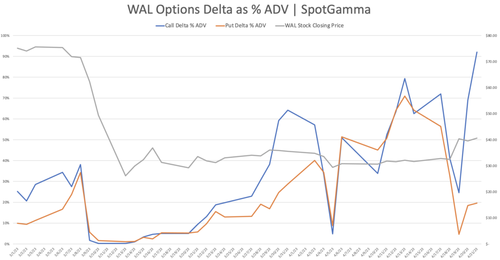
Additionally the major spike in options volume appeared as the stock opened on 3/13 and, if anything, helped to rally the stock off of opening lows of $12.
Conclusion: Options Did Not Drive the Stock Lower
This data all serves to imply that put options were NOT a driver of the stock lows as suggested by the Western Alliance CFO.
* * *
Subscribe here to access SpotGamma’s Founder’s Notes – Expert commentary packed with proprietary key levels, major support and resistance targets, and market analysis.
Loading…


