By Ven Ram, Bloomberg Markets Live author and cross-asset strategist.
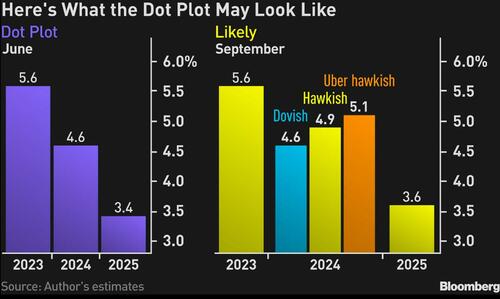
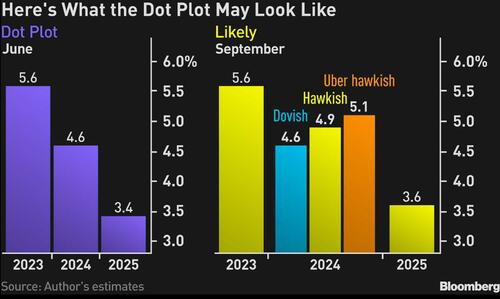
The Federal Reserve’s dot plot for September will push back on the notion of aggressive rate cuts that the markets are pricing in for next year.
The median of indications will show that policymakers expect a decline in the benchmark rate of as little as 50 basis points or 75 basis points for 2024, compared with the 100 basis points their plot showed in June. I expect the Fed to leave its dot plot for 2023 intact, with the funds rate indicated at 5.6%.

Investors have, of late, swung between pricing rate cuts between the spring and the summer of 2024, which the Fed isn’t in a position to acknowledge based on the current strength of the US economy. The most definitive way of pushing back against that notion is to pencil in less by way of policy loosening than the central bank did in June.
Since that meeting, headline inflation has accelerated, while inflation stripped of housing and energy is still hovering above 4%. Meanwhile, the jobless rate has averaged 3.6% so far this year, around as low as we have ever seen historically — and way below what the Fed estimates will be required to bring the labor market into balance.
The resilience of the job market may, in fact, spur policymakers to pencil in a lower unemployment rate for 2024 than the 4.5% they indicated in June.
Consistent with that outlook, the Fed may be disinclined to revise its 1% growth projection for next year by more than a whisker.
Those revisions are likely to mean that the Fed has reduced scope to loosen policy at the first sign of material weakness in the economy.
Given that James Bullard quit the Fed in August, the new set of projections will be lacking a prescient hawk, whose dot plot has been a rewarding schemata to follow for investors in this cycle. That suggests the skew between the median of the Fed rate projections for next year and top range will be considerably narrower.
An interesting corner of the summary of economic projections to watch will be the Fed’s assumption on the neutral real policy rate, which neither stokes inflation nor crimps output. For several years now the Fed has penciled in a longer-run funds rate of 2.50% predicated on inflation of 2%, thereby projecting a neutral rate of 50 basis points.
However, researchers at the New York Fed reckon that the real neutral rate will reach a staggering 250 basis points by the end of the year, one reason why Treasury long-dated yields have been sticky this late in the policy cycle.
All told, the dot plot and summary of economic projections is what will guide the Treasury market reaction, and from the looks of it, the markets may not like what they see.
Loading…
https://www.zerohedge.com/markets/dot-plot-show-fed-pushing-back-2024-pricing


